Single Cell and Spatial Genomics Facility
The CRUK City of London Centre Single Cell and Spatial Genomics Facility is based at the UCL Cancer Institute. The facility provides a streamlined service from samples processing and data generation to bioinformatics analysis. Established in 2020, the facility supports the full complement of 10x Genomics approaches. It currently runs a Chromium iX for single cell gene expression and multiome analysis, a CytAssist for Visium and Visium HD spatial transcriptomics slides and a Xenium in situ platform. In addition, the facility runs a Bruker CosMx Spatial Molecular Imager. After a project is agreed, users will provide the cell/nuclei suspension or tissue sections on slides (for spatial transcriptomics) to the facility which will run the desired assays. If NGS sequencing is required, we will advise on options either in house or through external providers. Quality control, visualisation of cell populations and differential gene expression analysis can then be carried out by our in-house bioinformatician. Bespoke analyses to fit the unique nature of the data is also part of the service.
Contact


The facility provides services to researchers associated with the CRUK City of London Centre. Training on the Chromium iX is possible for all UCL staff and students.
Yes. UCL staff and students can access the 10X Genomics Chromium iX but only after receiving relevant training. The equipment is bookable via Clustermarket and access to Clustermarket will be granted once training is complete.
No. These instrument are complex and only run as a service for researchers associated with the CRUK City of London Centre.
Please email Imran and Gordon with details about your role, your group leader and a brief explanation on what assay/ instrument you are interested in processing. We will then arrange a meeting to find out more about your experiment and explain to you how the facility works (also check our FAQ below). Once the meeting is complete, we will provide an estimated cost for the experiment which will include details about the reagents needed, the facility fees and sequencing costs if required.
If any optimisation or QC is required, these should be discussed at the meeting. Optimisations are generally conducted by the user (except for Visium Permeabilization optimisation which can be done at the facility), but we will do our best to help and advise.
Once all the kits have been ordered (and optimisations and QC, if required, are completed), a date is set for the experiment and an estimated turnaround time (TAT) is provided to the user.
Yes, an estimated cost for the experiment can be provided for funding and grant applications. Please get in touch and provide sufficient time before the grant deadline.
Users must provide the facility with the cell/nuclei suspension, as well as all relevant kits. A facility fee will be charged to users to recover additional costs. There is no charge for the bioinformatic analysis
Users must provide tissues sections on slides, and all relevant kits. Fixation, staining, imaging, and relevant slide preps are then conducted at the facility. A facility fee will be charged to users to recover additional costs. There is no charge for the bioinformatic analysis.
Turnaround times will be decided on an experiment-by-experiment basis. This is dependent on workload, annual leave, length of the run, and instrument availability. Please get in touch as soon as possible if you want to use the facility and get an estimated turnaround time.
This is dependent on the protocol/experiment you want to follow, the number of input cells you have and are interested in recovering.
Using the new GEM-X kits, for a typical recovery of 20,000 cells, we aim to load 30,000 cells into the Chromium iX. If these cells are being sorted beforehand, we recommend recovering around 80-100k cells on the sorter before submitting to the facility. Bead sorting and dead cell removal can be conducted using Miltenyi kits, if your samples don’t require FACS sorting, so please get in touch for more information.
For some applications, the GEM-X chemistry is not available yet, and samples will be processed using the NEXT-GEM kits instead. Those enable you to capture up to 10,000 cells and again we aim to load 30,000 cells into the Chromium iX.
Please get in touch to find out which chemistry your samples may fall into or see the experiment list below, which has more details on this.
– Single Cell Gene Expression (3’GEX kit – GEM-X)
– Single Cell Immune Profiling (5’GEX kit with TCR/BCR sequencing – GEM-X)
– Single Cell Multiome ATAC + Gene Expression (nuclei optimisation is required beforehand by user – NEXT-GEM) – Single Cell ATAC (NEXT-GEM)
– CITE-Seq (quantification of proteins with RNA) on both 3’GEX and 5’GEX kits. Antibody optimisation may be required by the user
– CellPlex (multiplexing samples –only available on the 3’GEX NEXT-GEM kit)
– Single Cell Gene Expression Flex (fixation conducted by the user – GEM-X)
– Singel Cell Gene Expression from FFPE samples using the Flex kit (GEM-X)
The list above is as of February 2025, please get in touch to find out what the latest experiments we can perform at the facility.
– Spatial Gene Expression for FFPE (Visium)
– Spatial Gene Expression for Fresh Frozen (Visium)
– Visium HD (FFPE and FF)
– Whole array of panels on the CosMx, including the 6k panel
– Whole array of panels on the Xenium, including fully customisable panels and 5k panel.
For latest information about panels available on each platform or information about the panels, please get in touch with the facility.
The Xenium in situ platform (10x genomics) and the CosMx Spatial Molecular Imager (SMI, Bruker) allow measure expression of thousands of transcripts on tissue sections in situ. Both platforms are microscopes with a microfluidics components that can detect up to several thousands of different RNA species in single cells using predesigned panels of fluorescent probes. In addition, both platform support proteins detection using antibody panels. Because they are imaging-based these approaches are very good at resolving single-cell boundaries and provide sub-cellular localisation of transcripts.
The Xenium runs two slides in parallel, with a capture area of 22mm x 10mm per slide. The CosMx runs either two or four slides in parallel and has a capture area of 20mm x 15mm.
Please get in touch with the facility and we will help you decide which platform is better suited to your project.
For more information see:
Xenium: https://www.10xgenomics.com/support/in-situ-gene-expression
CosMx: https://nanostring.com/products/cosmx-spatial-molecular-imager/single-cell-imaging-overview/
The Visium technology allows to capture and sequence full transcriptomes from tissue sections while retaining information about transcripts positions within the tissue. In practice, tissue sections are permeabilised and their RNAs transferred onto Visium slides using an instrument called CytAssist. The Visium slides are printed with arrays of spatially-barcoded oligonucleotides that mediate capture and library preparation (spots). The Visium slides have an array of 5000 spots, 100um in diameter, and separated by 50um. The Visium HD slides have an array of ~11.2 Mil spots, 2um x 2um in size, and adjacent. Both technologies have a capture area of 6.5mm x 6.5mm.
Visium is a sequencing-based approach and spots on the slides are not immediately connected to specific cells. It has the advantage to samples full transcriptomes and leads to data similar to those produced by scRNA-seq.
For more information see:
Visium: https://www.10xgenomics.com/support/cytassist-spatial-gene-expression
Visium HD: https://www.10xgenomics.com/support/spatial-gene-expression-hd
This method measures gene expression (mRNA abundance) in single cells. Because of this, the technique can reveal heterogeneity within a cell population, identifying and characterising rare cell types without prior knowledge of cell subtypes or cell markers. You can define novel cell types and cell states and discover new biomarkers for specific cell subpopulations. You can analyse and understand cellular heterogeneity and see how this contributes to the biological system you are interested in.
An example of a clustering and gene expression analysis performed by the single cell genomics facility bioinformatician is shown in Figure 1.
Publications using Single Cell Gene Expression techniques can be found here: https://www.10xgenomics.com/resources/publications/?solution=single-cell
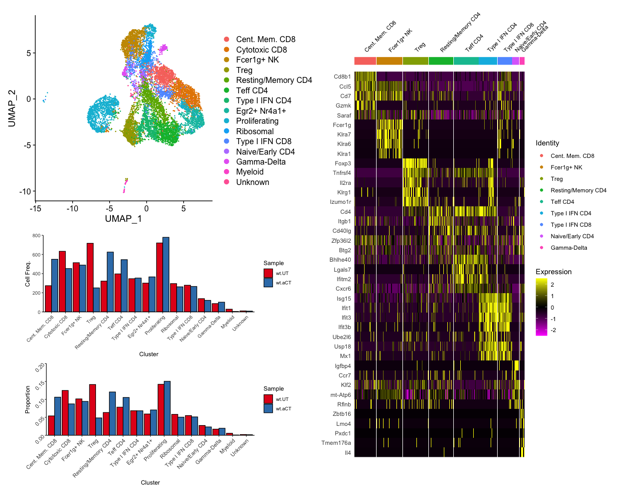
Figure 1. Determining T cell subtypes present in a mouse tumor model, and comparative analysis of T cell population changes between untreated (wt.UT) and ⍺-Ctla4 treated (wt.aCT) tumor microenvironments.
This approach enables the user to assay the TCR or immunoglobulin chain and expression profile of each immune cell in their sample simultaneously. Clonality and repertoire diversity can then be assessed in the context of immune subtypes for tens of thousands of cells.
Feature barcoding technology uses barcode conjugated antibodies which can bind specific surface markers, and can be applied in parallel to the immune profiling approach. This enables additional profiling of antigen specificity or key cell surface molecules.
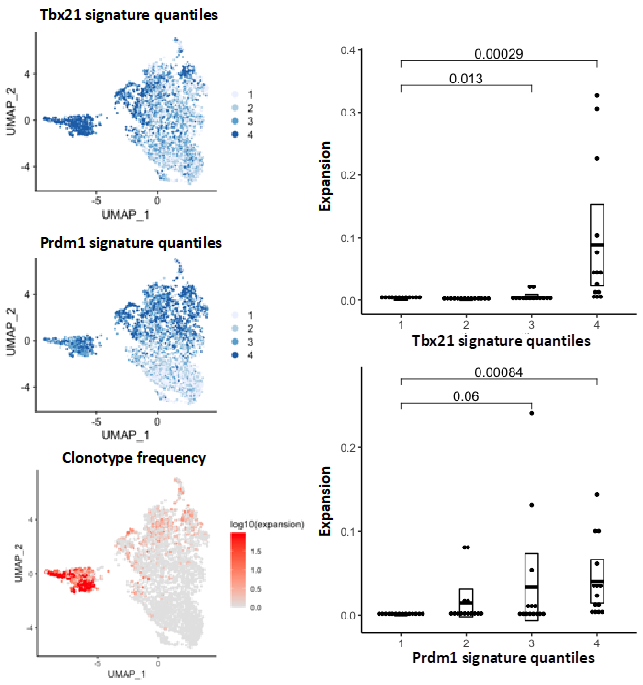
An example of a TCR clonality analysis performed by the single cell genomics facility bioinformatician is shown in figure 2.
 Publications using Single Cell Immune Profiling techniques can be found here: https://www.10xgenomics.com/resources/publications/?solution=vdj
The Single Cell Assay for Transposase Accessible Chromatin (ATAC) solution allows you to map the epigenetic landscape at a single cell resolution. Open chromatin regions can be identified, as the technique uses a transposase enzyme to preferentially tag accessible DNA regions with sequencing adaptors, which enable you to create a sequencing ready library. Tens of thousands of cells can be analysed to understand the epigenetic and regulatory variations.
The technique allows you to investigate and compare open chromatin in regions of interest and cluster and identify cells based on open chromatin regions and enriched transcription factor (TF) motifs.
Further publications using Single Cell ATAC Seq techniques can be found here: https://www.10xgenomics.com/resources/publications?page=1&sortBy=publications-relevance&query=&refinementList%5BproductGroups%5D%5B0%5D=Single%20Cell%20ATAC
The Multiome Assay enables you to profile gene expression and open chromatin from the same cell, across thousands of cells.
This technique allows you to Integrate gene expression with epigenomic landscape through direct measurements from the same cell, eliminating the need for computational inference across datasets. You are able to link chromatin regions and target genes to discover new gene regulatory interactions.
Nuclei isolation optimisation is required by the user (before submitting samples to the facility to process using the assay), to ensure that both RNA and Chromatin information can be obtained from the same nuclei. Please get in touch to find out more about the multiome assay and what the nuclei isolation optimisation steps entail.
Further publications using Single Cell Multiome technique can be found here:
https://www.10xgenomics.com/resources/publications?refinementList%5BproductGroups%5D%5B0%5D=Single%20Cell%20Multiome%20ATAC%20%2B%20Gene%20Expression&page=1
Cellular Indexing of Transcriptomes and Epitopes by Sequencing (CITE-Seq) uses DNA-barcoded antibodies to convert detection of proteins into a quantitative sequence-able readout. Antibody-bound oligos act as synthetic transcripts that are captured during the 10X Genomics Gene Expression protocol. This allows for immune-phenotyping of cells with a potentially limitless number of markers and unbiased transcriptome analysis using the 10X Genomics approach.
Further publications using Single Cell CITE-Seq techniques can be found here:
https://cite-seq.com/publications/
This is dependent on user requirements, but the minimum reads depths are below.
|
Experiments |
Sequencing Depth |
|
3ʹ Gene Expression Library |
Minimum 20,000 read pairs per cell |
|
5′ Gene Expression library |
Minimum 20,000 read pairs per cell |
|
3’ Cell Surface Protein Library |
Minimum 5,000 read pairs per cell |
|
5’ V(D)J Enriched library |
Minimum 5,000 read pairs per cell |
|
5’ Cell Surface Protein library |
Minimum 5,000 read pairs per cell |
|
Single Cell ATAC |
Minimum 25,000 read pairs per nucleus |
|
CITE-Seq |
Minimum 5,000 read pairs per cell |
|
Visium FFPE (Probe based) |
125 Million Reads per capture area |
|
Visium FF (RT based) |
250 Million Reads per capture area |
|
Visium GEX (CytAssist) 6.5mm x 6.5mm Capture |
125 Million Reads per capture area |
|
Visium GEX (CytAssist) 11mm x 11mm Capture |
350 Million Reads per capture area |
|
Visium HD (Probe based) |
275 Million Reads per capture area |
Yes, each tissue type processed on the Visium Fresh Frozen kit must be optimised in order to determine the correct tissue permeabilization time. This step can be conducted at the facility.
Everyone with access to the Single Cell Genomics Facility (as outlined above) also has access to bioinformatics support. Advice on platform, cell numbers, cell health and other factors which can affect downstream analysis can be provided prior to running your experiment. Once data are received, an entire bioinformatics pipeline can be provided by the facility, complete with bespoke analysis based on feedback and requirements from the user.
Users can also request analysis on data that has not been generated by the facility. A large amount of single-cell and spatial data is available from databases such as NCBI GEO and SRA. Novel insights from these datasets could be the basis for preliminary data for a grant proposal or form a complete meta-analysis study. Table 1 lists several scRNA-seq datasets that are available as user-friendly interactive webpages.
We are always looking to add new techniques and instruments into the facility. Please get in touch to find out about the latest services we provide and if you have any suggestions on services/ instruments you would like us to provide so we can explore the options.
|
Dataset |
Organism |
Author/Year |
Title |
Link |
|
NSC Lung Cancer, T-cell |
Human |
Guo et al., 2018 |
Global characterization of T cells in non-small-cell lung cancer by single-cell sequencing |
|
|
Colo-rectal, T-cell |
Human |
Zhang et al., 2018 |
Lineage tracking reveals dynamic relationships of T cells in colorectal cancer |
|
|
Colo-rectal, T-cell (w/TCR) |
Human |
Zhang et al., 2019 |
Deep single-cell RNA sequencing data of individual T cells from treatment-naïve colorectal cancer patients. |
|
|
Colon Cancer, Myeloid, T-cell |
Human, Mouse |
Zhang et al., 2020 |
Single-Cell Analyses Inform Mechanisms of Myeloid-Targeted Therapies in Colon Cancer |
|
|
Liver Cancer, T-cell |
Human |
Zheng et al., 2017 |
Landscape of infiltrating T cells in liver cancer revealed by single-cell sequencing |